Why is my table late? Tracing pipeline delays through hundreds of dependencies
When a table lands late, the cause is often far upstream. How a dependency service we designed finds the blocker and estimates when the data will arrive.
A daily table that lands late is rarely late on its own. Somewhere upstream, often dozens or hundreds of steps away, a job is stuck, slow or waiting on something else. The person who owns the table usually can’t see that far. This article describes the dependency service we designed to answer “why is my table late?” quickly, without walking the whole pipeline every time someone asks.
Key takeaways
- Treat data assets as nodes and their dependencies as edges, and keep that graph in sync with what is deployed.
- Work out status ahead of time, then refresh only the paths a change actually touched.
- Compare live progress with history, so “running” can be told apart from “running late”.
Why is a late table hard to explain?
In a large data warehouse a single table can sit at the end of a chain 100 to 500 levels deep. Each level is another dataset built by another pipeline step. Tracing that by hand means opening run after run until you find the one that’s stuck. The person asking is usually a data scientist or analyst who just wants to know when their table will be there.
Model it as a graph
Every table, partition or file is a node. An edge says “this is built from that”. If dataset C is built from A and B, the graph holds both links. With the graph in place, “what does my table need?” becomes a lookup, not an investigation.
Don’t walk the whole graph on every question
Tracing hundreds of levels from scratch for each question is expensive. The service splits the work three ways:
- Precompute. A periodic pass pushes progress and blockers downstream and stores the result for fast lookup.
- Invalidate selectively. When a node changes state, only what sits downstream of it is marked stale. Unrelated branches keep their answers.
- Recompute lazily. A query that meets a stale entry refreshes just that path, usually a narrow line rather than the whole graph, and the next query reuses the result.
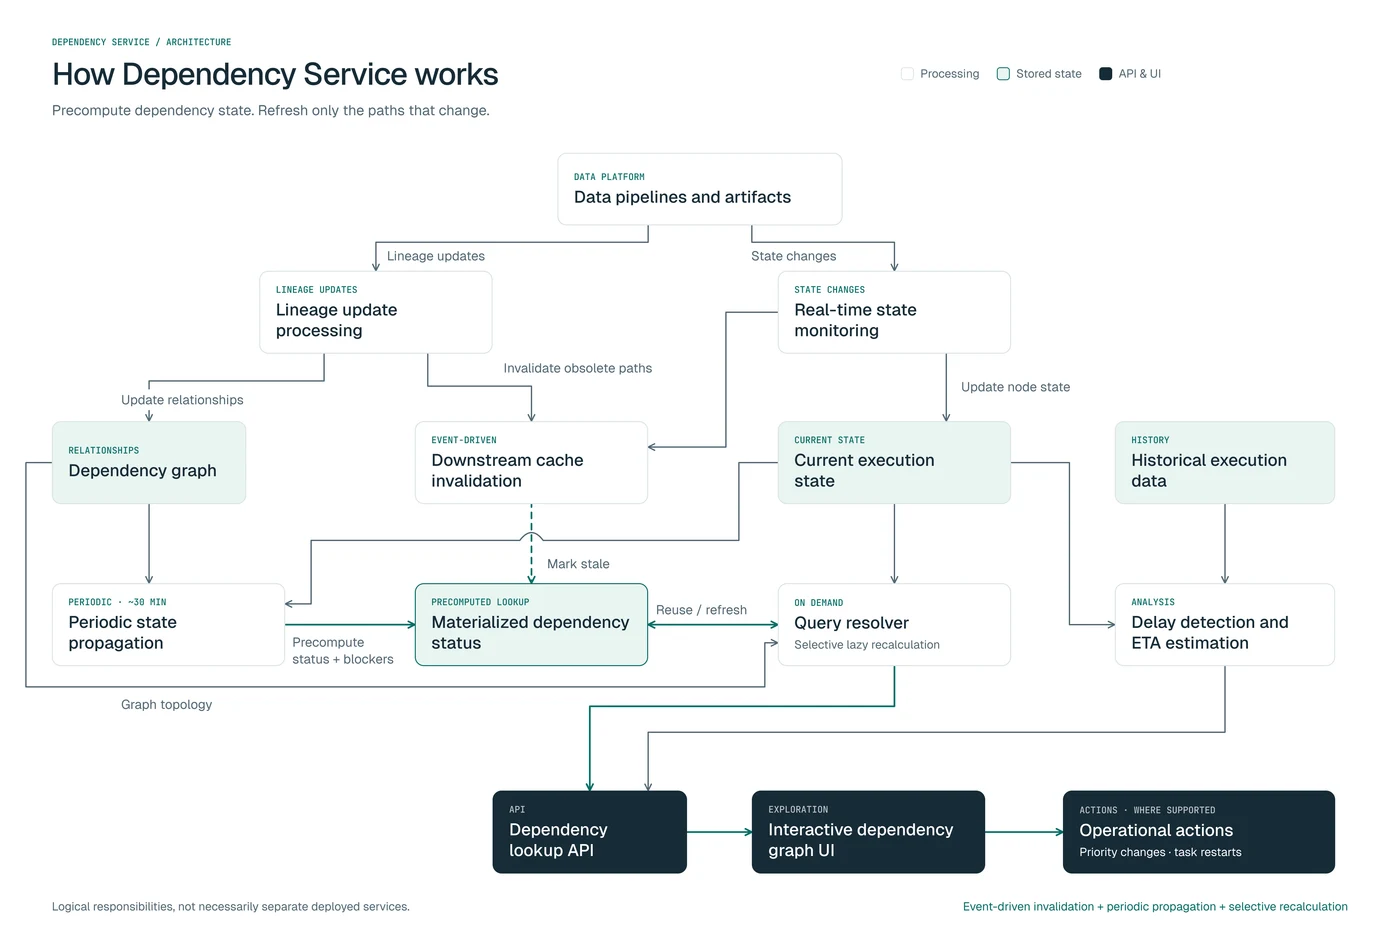
In use, questions about chains hundreds of levels deep came back in a few hundred milliseconds, around 500 ms at most. That is what we observed, not a guaranteed figure.
Running is not the same as late
A long-running job isn’t necessarily a problem; some jobs always take a long time. The service keeps a history of run times and arrival times, so it flags only jobs running longer than their own normal. The same history drives an arrival estimate for the requested table, based on how far work has got and what is still left upstream.
Lineage changes, so the graph must too
Pipelines change. When a new version starts reading different inputs, the graph follows the deployed lineage, retires the old links and refreshes the affected status. Nobody rebuilds a dependency map by hand, and troubleshooting always runs against the current structure.
From diagnosis to action
The view shows where work is happening right now, rather than every step that hasn’t started yet. From the blocking job, an operator can restart it or raise or lower its priority, where the pipeline system allows it. Diagnosis and the supported actions sit in the same view.
What this changes for an operations team
A late table starts with a likely answer instead of a manual trace: the blocker, whether it is slower than usual, and when the data should land. The same idea applies beyond data. A stalled network rollout has the same shape as a late table: something upstream is holding things up. If your team spends its mornings tracing why something is late, talk to us.
Frequently asked questions
What is data lineage?
The record of which datasets each dataset is built from. A dependency graph is lineage you can query: ask about one table and get back everything it waits on.
Why not check each job on its own?
Each job's status tells you about that job. The graph joins those states, so you can see how a delay far upstream affects your table, and which single step is holding it up.
How accurate is the arrival estimate?
It is an estimate, not a guarantee. It combines how far the work has progressed, what is left upstream, and how long the same jobs and datasets usually take.